MethMotif database is a novel two-dimensional transcription factor binding site (TFBS) database. Integrated with whole genome bisulfite sequencing (WGBS), DNA methylation levels within transcription factor binding sites, uncovered by ChIP-seq experiments, are approachable. Due to the dynamic chromatin accessbility and transcription factor expression, we opt to de novo discover TFBS and map its DNA modification in cellular context. Here, we took the advantage of protein ChIP-seq datasets in various cell types downloaded from ENCODE. With the aid of WGBS, methylation levels in CpG context were captured in a +/- 100bp window surrounding peak summits for all ChIP-ed proteins with good reproducibility between experiment replicates (Figure 1). For each cell type, the distribution of CpG beta scores, a methylation status indicator (Adusumalli et al. 2014), for each ChIP-ed protein was plotted as heatmap. Users can explore the protein of interest according to its DNA methylation profile in heatmap in Section "Explore" (detail manual see "Explore the interplays between proteins and DNA methylation")

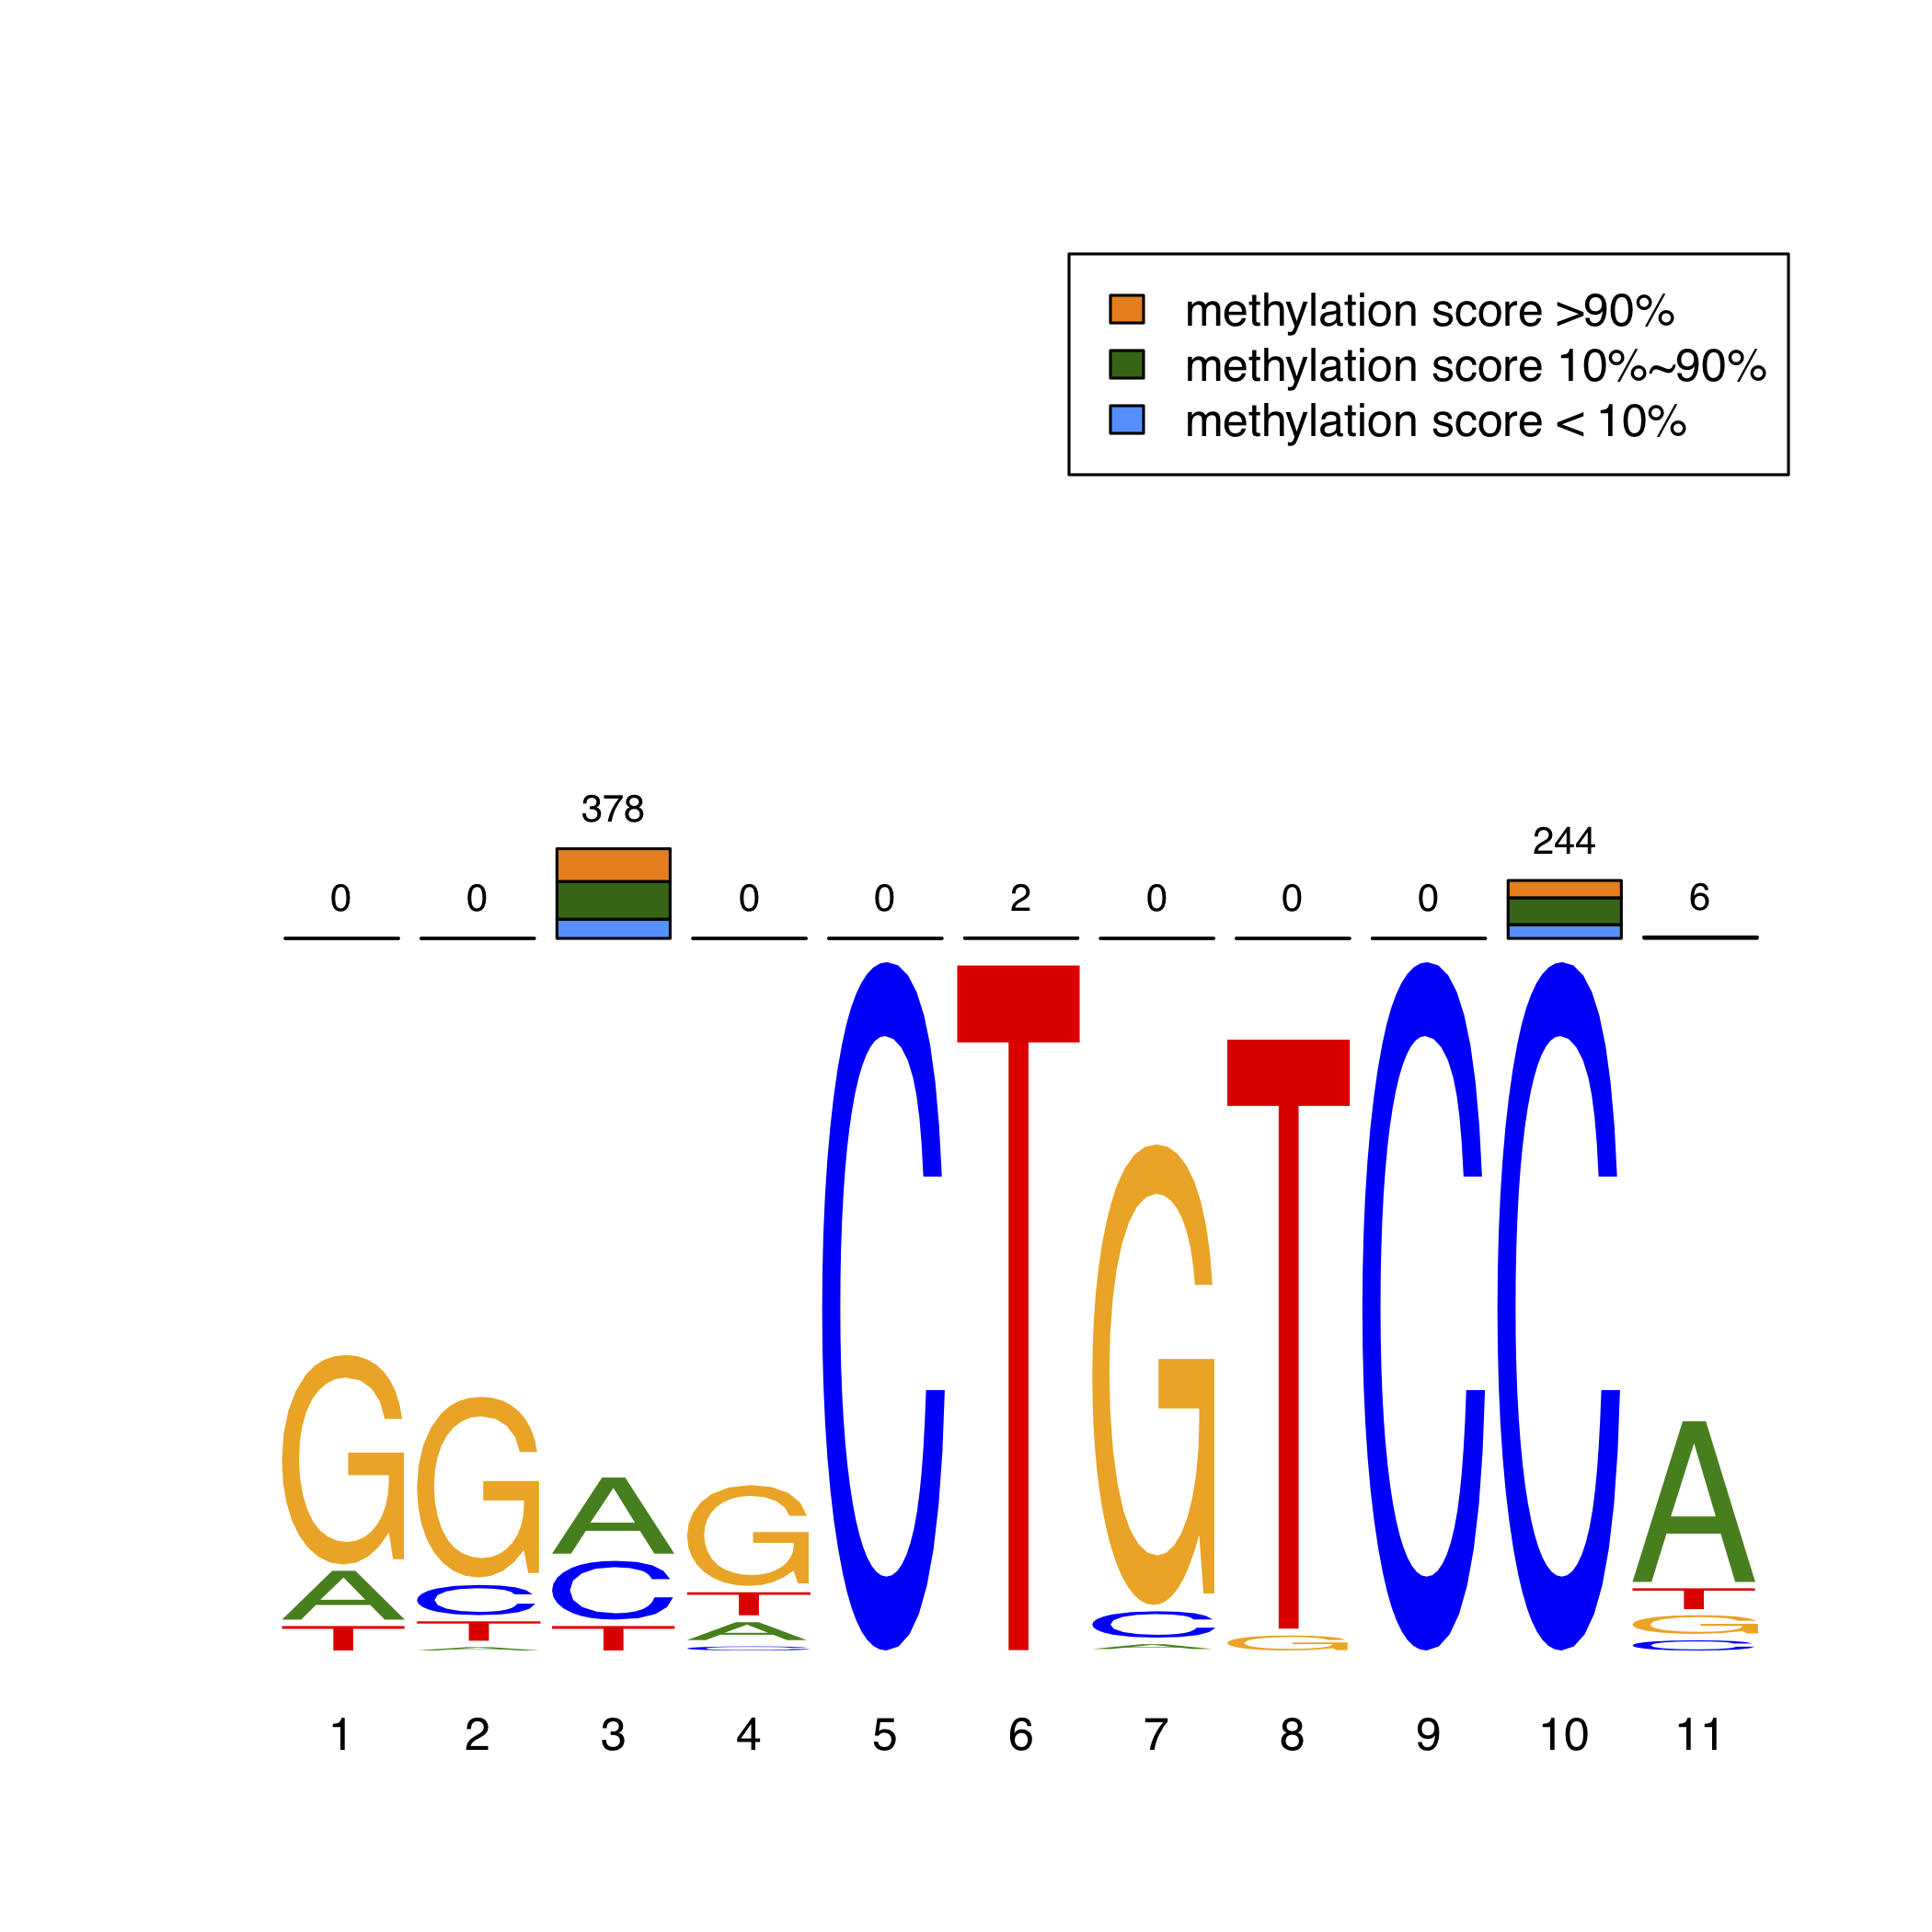
Furthermore, we identified transciption factors and de novo enriched their direct DNA binding sites (motifs) using MEME-ChIP package. Then, we focused on the methylation status of CpG exactly within the motifs. In order to intuitively exhibit the methylation levels in TFBS, we adopted a novel MethMotif logo. Here, we show REST MethMotif logo in HCT116 as an example (Figure 2). The REST motif in HCT116 is shown as bottom motif logo. The number of unmethylated CpGs inside the REST motif is shown as blue bar (methylation score < 10%) while the number of methylated CpGs is shown as orange bar (methylation score > 90%); the total amount of sequences containing the CpG covered by WGBS is represented as numbers on the top of bars. Users can query the MethMotif information of transcription factors of interest in Section "Motif Database" (detail manual see "Query MethMotif database").
We have also implemented a "MethMotif Batch Query" in our website to allow users to search real TFBSs along with their corresponding methylation levels in the provided genomic regions (detail manual see "Batch query MethMotif in regions of interest").
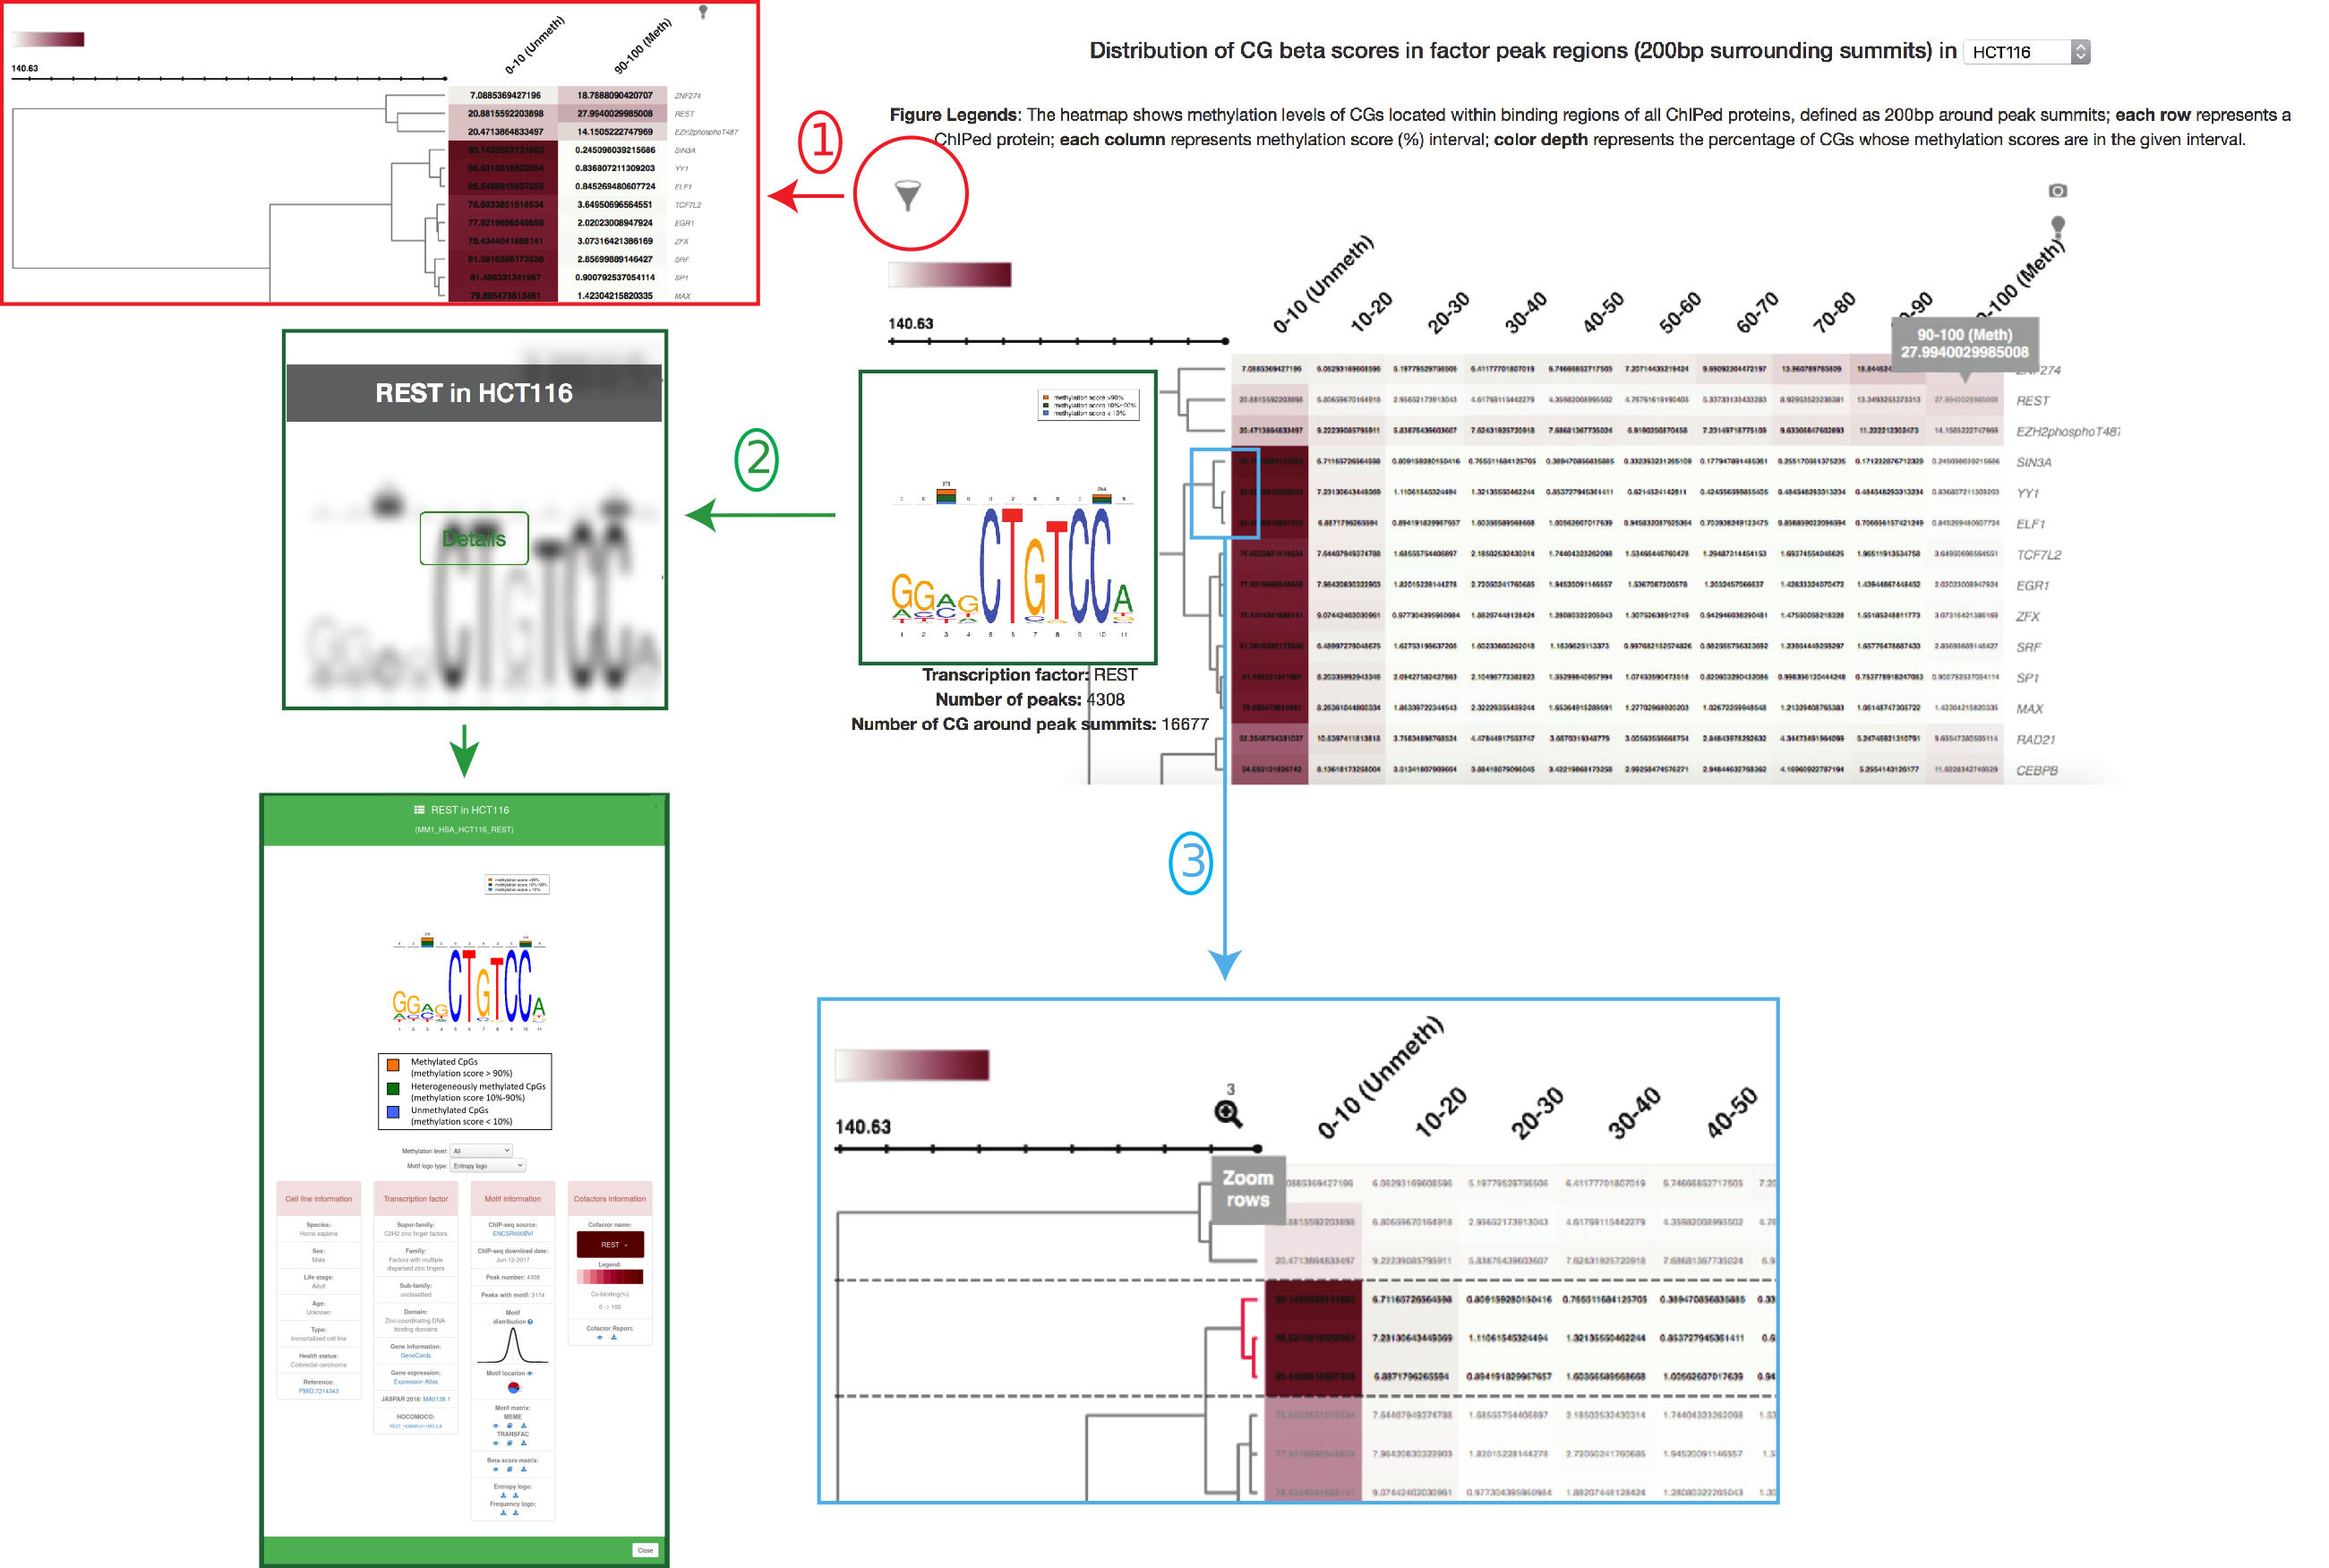
In section "Explore", users can choose the cell type of interest on the top of the page. A heatmap which displays the distribution of CpG beta scores in the ChIP-ed protein peak regions, defined as 200bp surrounding peak summits, in the cell type will be automatically shown upon user's selection. Here, we illustrate the heatmap in HCT116 (Figure 3). In the heatmap, each row represents a ChIP-ed protein while each column represents a methylation score (%) interval. Color range represents the percentage of CpGs in the given methylation score interval. When mouse hovering a cell inside the heatmap, some numbers as well as a MethMotif logo (if the factor is transcription factor with a enriched motif) will be automatically and dynamically appearing. The numbers shown above the hovered cell are the methylation score interval, e.g., 90-100(%), and the percentage of CpGs in the given interval, surrounding the selected factor peak summits. Below are three useful tips to help users intuitively explore the heatmap.
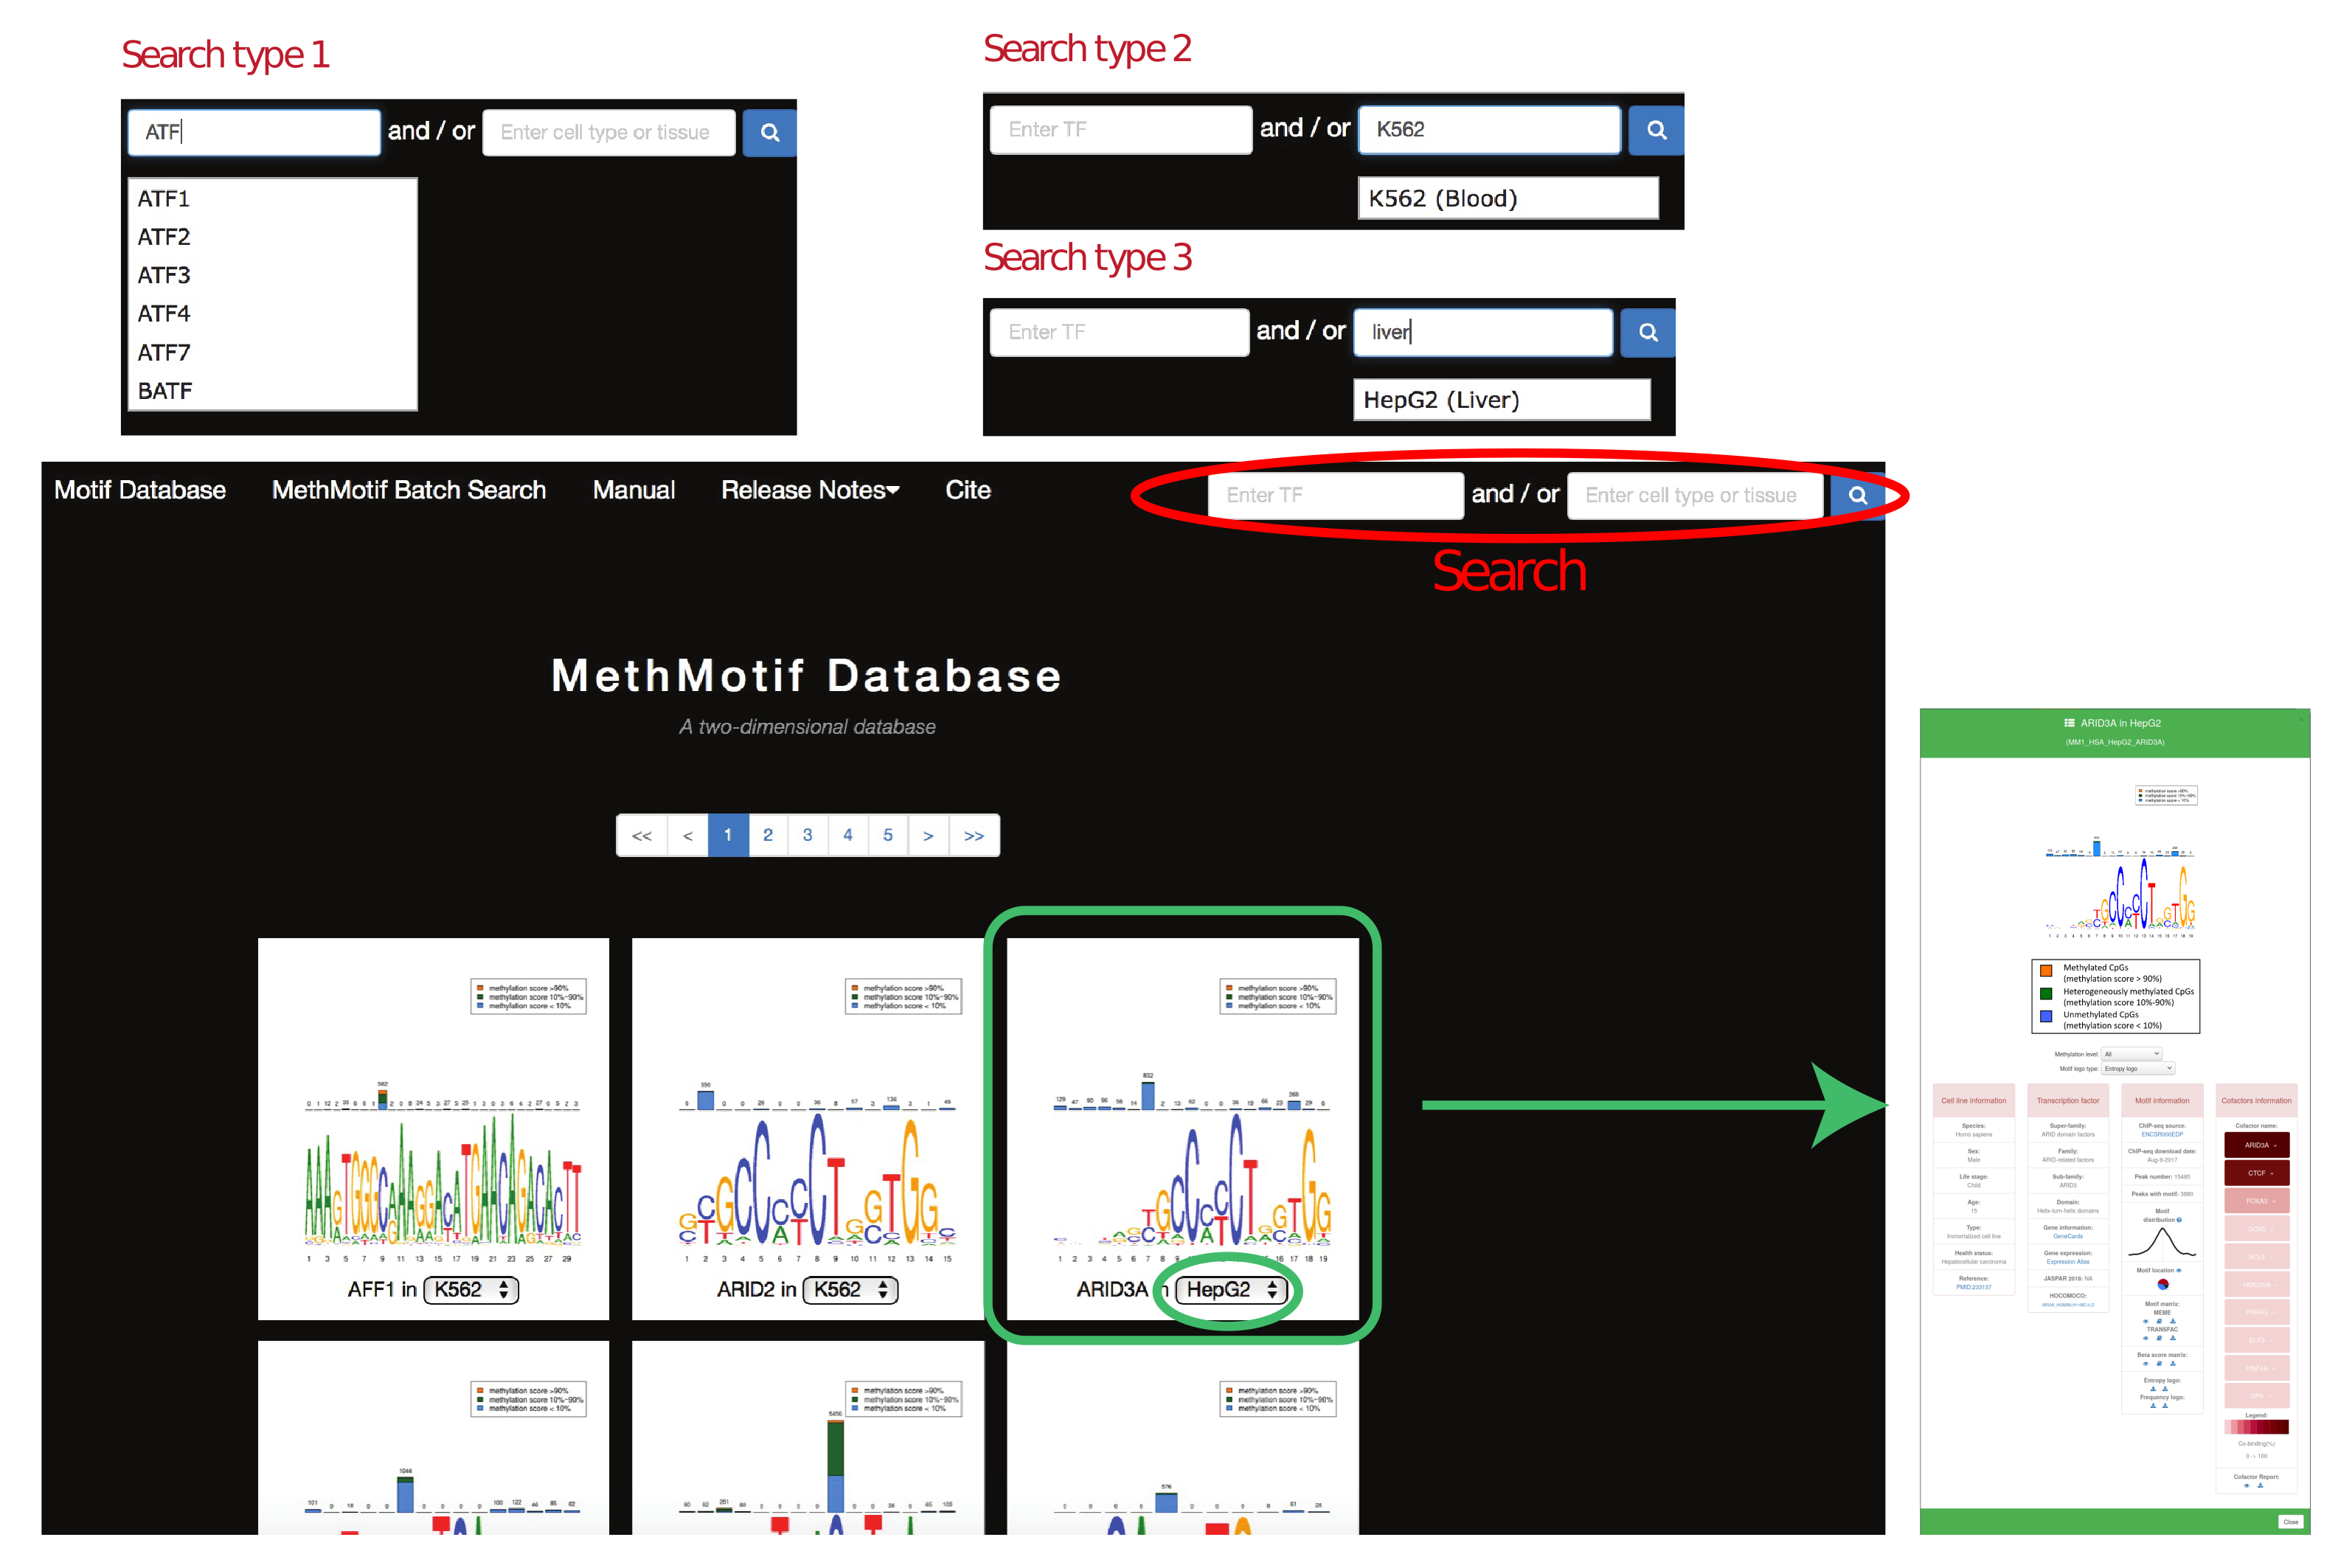
In "Motif Database", users are able to access to detailed information of transcription factor in each cell type by hovering over the MethMotif logo. A MethMotif card will pop up upon clicking the "Details" button. In addition, a search form is available at the top right corner of the page, allowing users to fast query the transcription factors of interest (Figure 4)
1.1. MethMotif ID: Each TFBS in a given cell type of a species has been assigned with a unique ID (Figure 5), to facilitate retrieve and management of TFBSs in MethMotif database. Each MethMotif ID contains four parts, namely MethMotif version (e.g. MM1 - MethMotif version 1), species (e.g. HSA - human), cell type or tissue (e.g. HCT116) and TF (e.g. REST), and they are concatenated with underscore (e.g. MM1_HSA_HCT116_REST).
1.2. MethMotif Logo: Motif logo in entropy (default) and in frequency as well as their reverse ones are available by selecting in option panel.
1.3. Forked Logo: Forked logo in entropy where the first bases before the fork correspond to the mainTF of interest (Figure 6). The mainTF motif is connected via a fork with continuations of the logo depending on the binding partner. The logos show the methylation levels for each of the nucleotides in the binding site. The percentage on top of each forked arrow displays the amount of overlapping between the TF of interest and each of the binding partners.
1.4. Cell type information: cell type information, if any, in terms of species, sex, life stage, age, cell line type, health status and corresponding reference are included here.
1.5. Transcription factor: the detailed classifications, general information, expression levels and external links to JASPAR and HOCOMOCO, if any, are available in the panel.
1.6. Motif information: here users can access to: i) the source of ChIP-seq datasets; ii) the date when the ChIP-seq was downloaded; iii) number of IDR peaks; iv) number of peaks containing the TFBS; v) motif loctions vi) functions to view, open and download motif matrix in MEME and TRANSFAC format (click here to know more about MEME and TRANSFAC format); vii) functions to view, open and download beta score matrix. In beta score matrix, there are four rows: the first row is the nucleotide orders inside TFBS sequence; the next three rows are the amounts of CpGs, whose beta scores less than 10% (2nd row), 10-90% (3rd row) and more than 90% (4th row), in the corresponding positions. viii) functions to download MethMotif logo and reverse logo in PDF format.
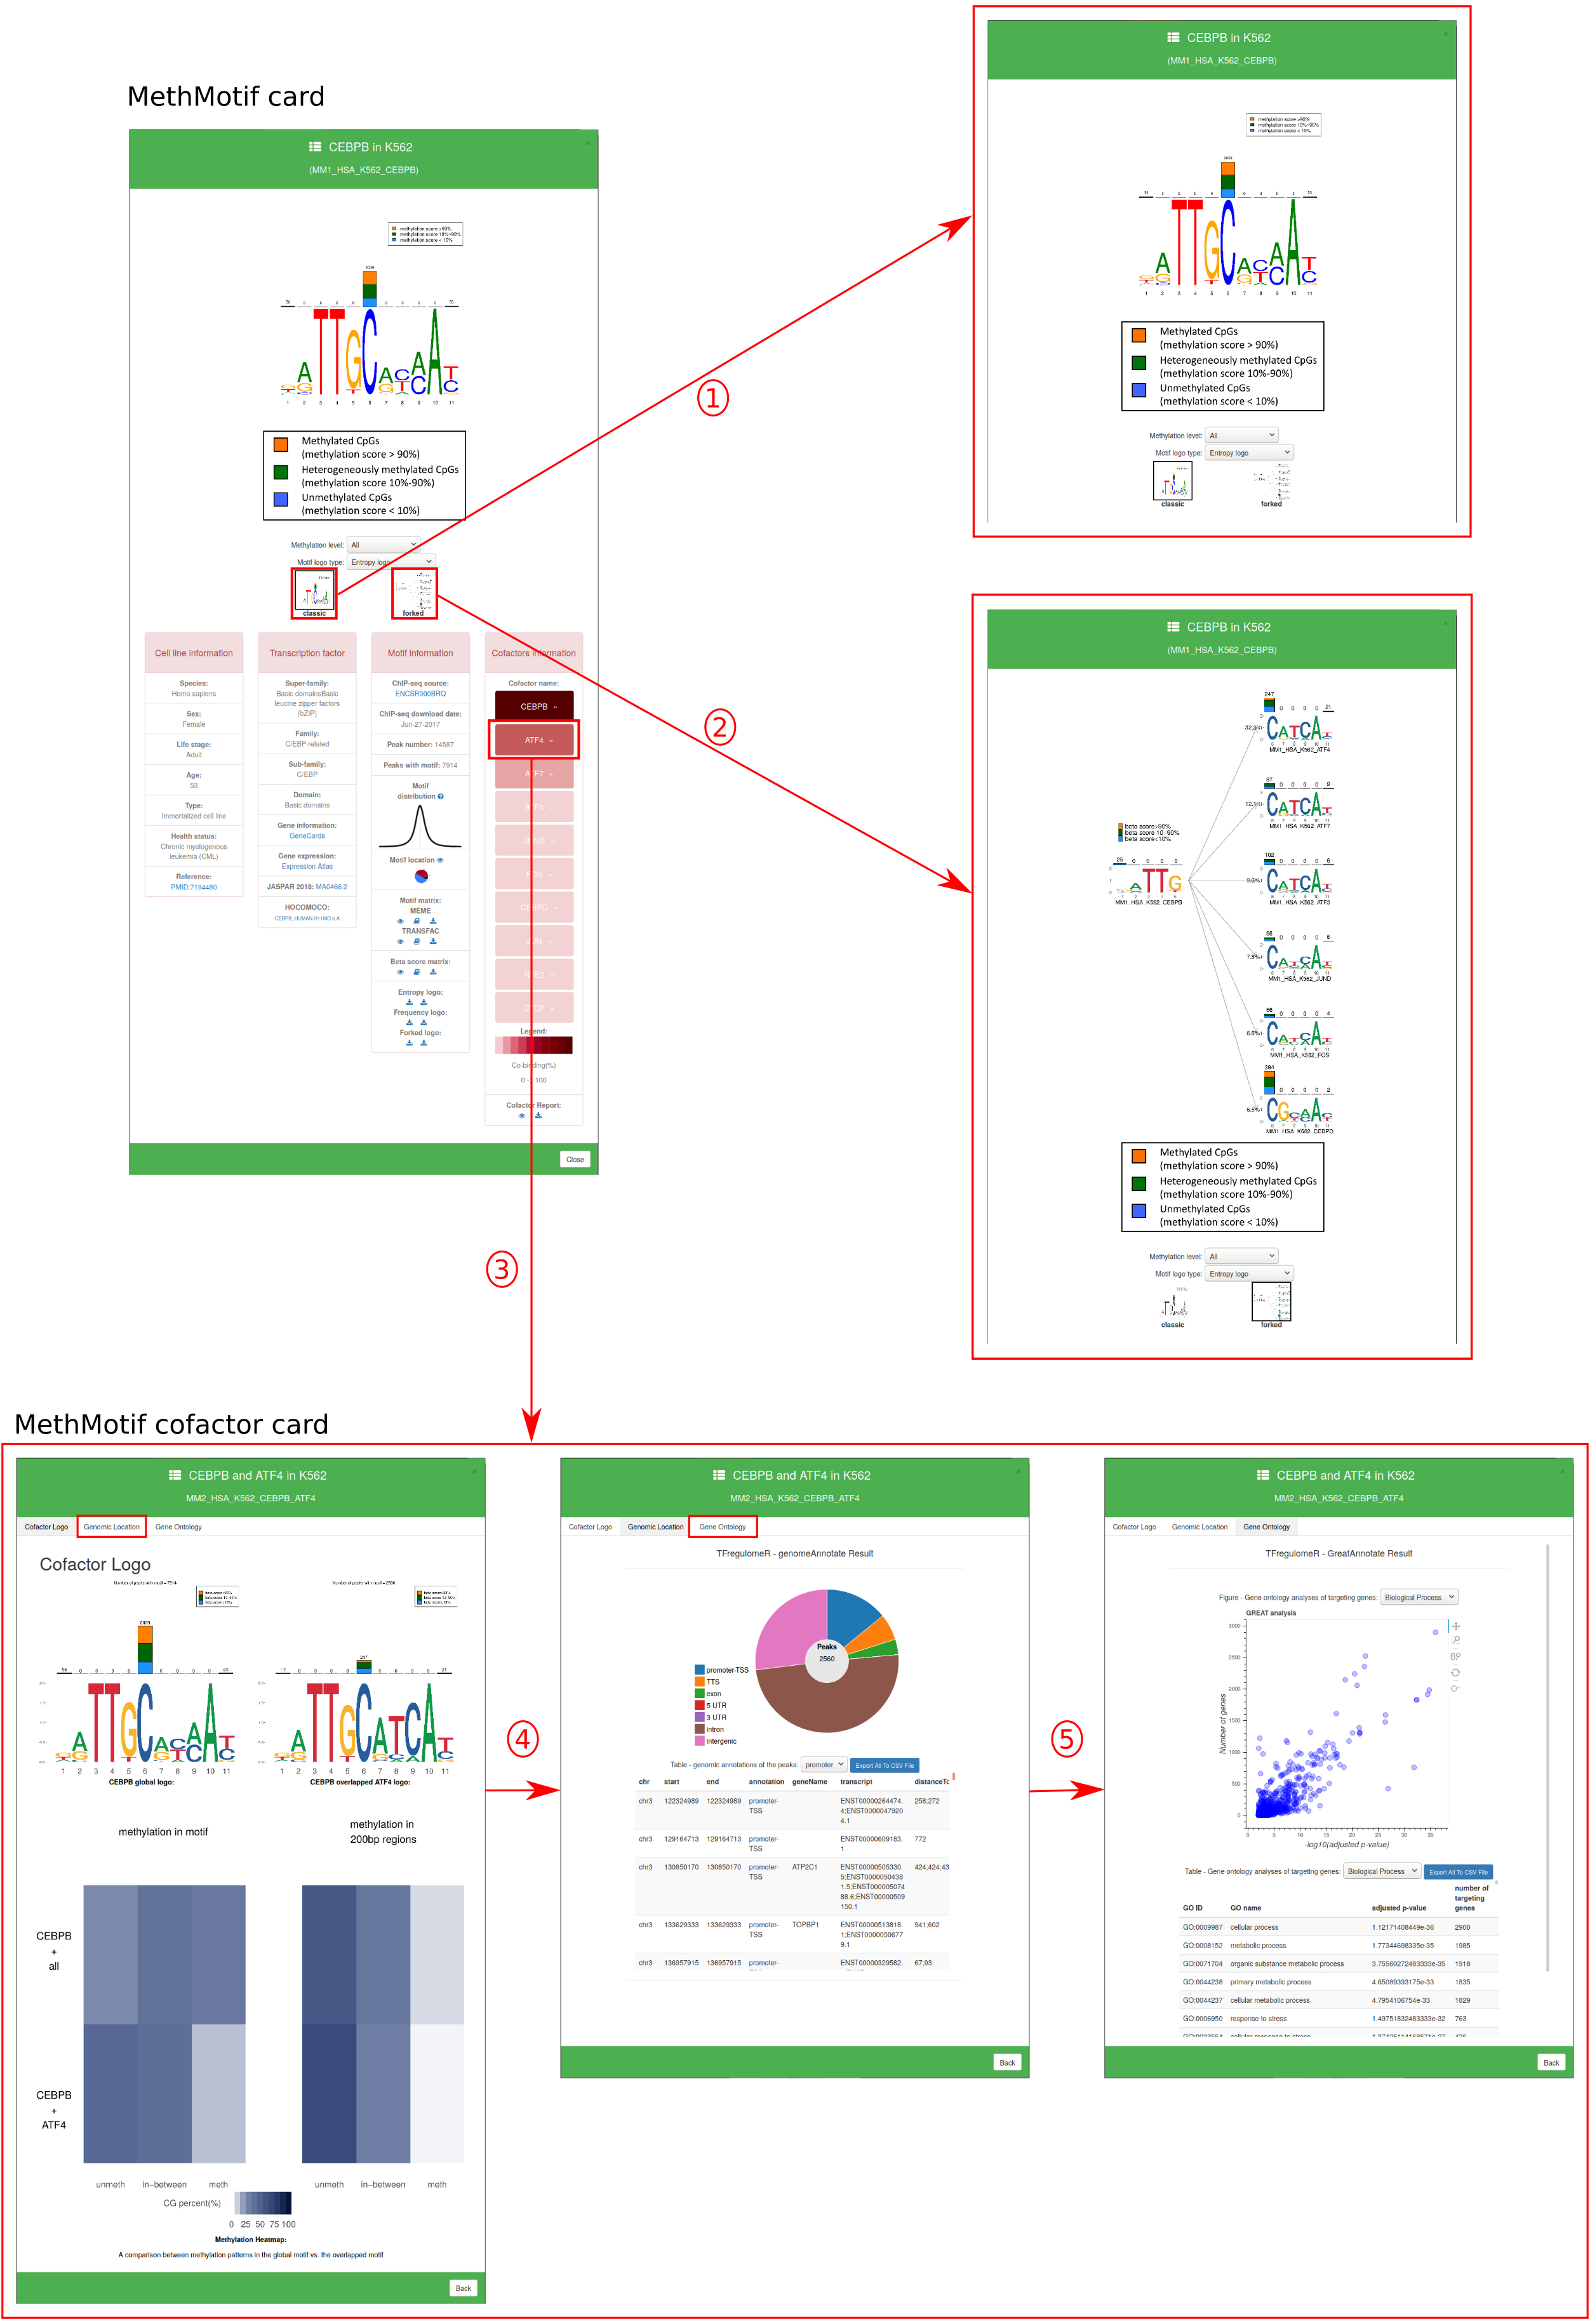
1.7. Cofactor information: here users can access: i) all of the cofactors for their selected TF. Each cofactor is a button which when clicked will bring you to the Cofactor card. The secondary function of the cofactor button is to display through colour the percent overlap between a main TF and its partner; ii) the mini-cofactor report (a quick overview of the information available within the cofactor card) can be viewed or downloaded.
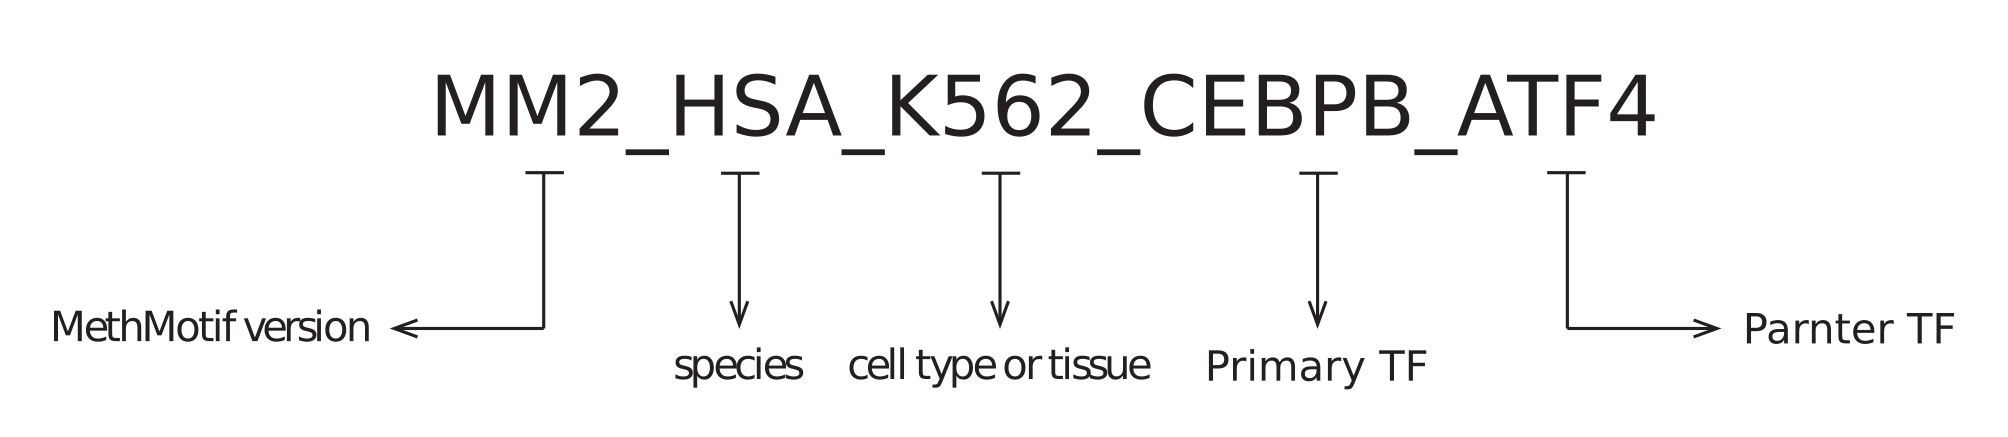
1.1. Cofactor ID: Each overlapped TFBS in a given cell type of a species has been assigned with a unique ID (Figure 7). Each MethMotif ID contains four parts, namely MethMotif version (e.g. MM2 - MethMotif version 2), species (e.g. HSA - human), cell type or tissue (e.g. K562), main TF (e.g. CEBPB) and partner TF (e.g. ATF4), and they are concatenated with underscore (e.g. MM2_HSA_K562_CEBPB_ATF4).
1.2. Cofactor Logo: Motif logo in entropy is available for the global motif and overlapped motif. A stacked methylation heatmap is diplayed under the aformetioned logos. The top of the heat map represents methyaltion in the global motif, while the bottom shows methylation specifically at the overlap regions. (Figure 6)
1.3. Genomic Location: Genomic location plot provides the number of peaks found in a specified genomic region. The data is present below in a data format, this table can be downloaded. (Figure 6)
1.4. Gene Ontology: Gene ontology plot prvovides ontologies under: Biologoical processes, Molecular function, and Cellular component. All the data used to create this plot is available below the plot in table format. The table can be downloaded. (Figure 6)

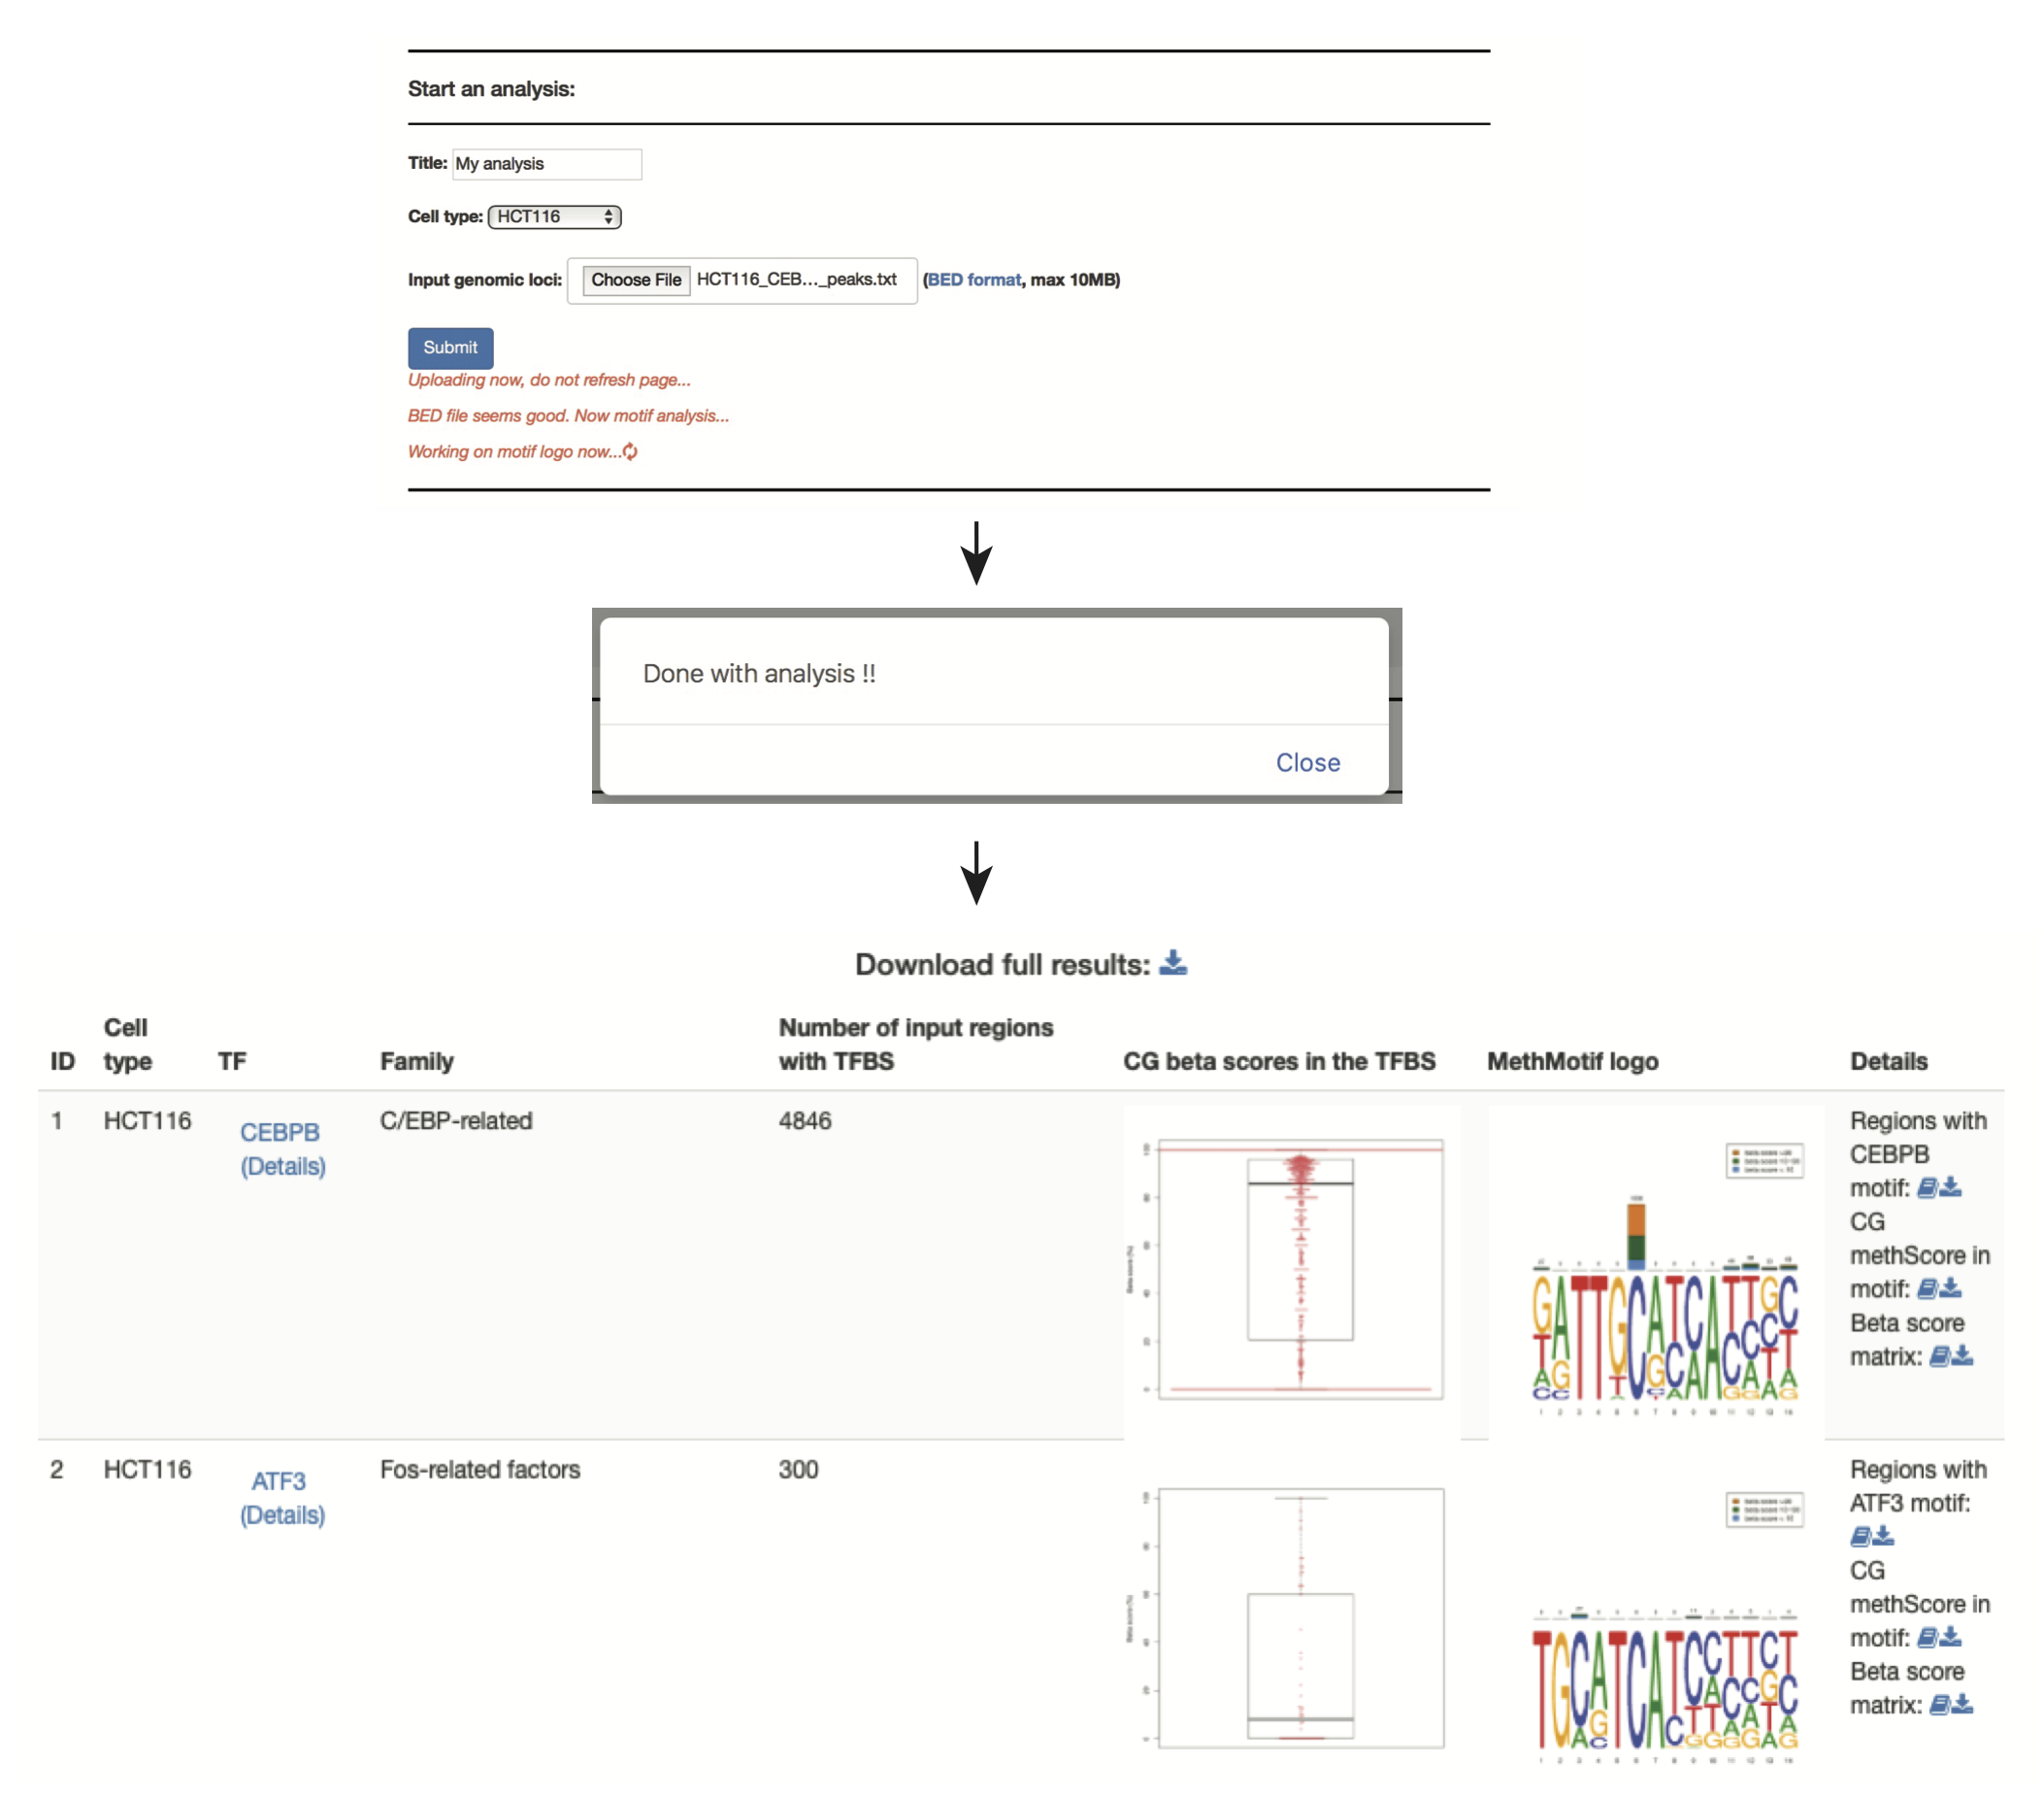
"MethMotif Batch Query" is a tool implemented in MethMotif website, which allows users to study the occurrences of TFBSs along with their respective DNA methylation states within a given list of genomic loci (Figure 8). When users provide the genomic location coordinates, batch search tool will map those regions in MethMotif database and fetch the TFBSs as well as their CpG methylation levels in a given cell type.
Input for MethMotif Batch Search:
1.1. Analysis title
1.2. Cell type
1.3. Input file: file should be in BED format with genome assembly of hg38 (click here to know more about BED format). Briefly, the file should be tab delimited with at least three columns, namely chromosome (must start with "chr"), start and end.
Output for MethMotif Batch Query:
A result table will automatically appear after tool runs successfully and the pop-up window is closed. The table includes selected cell type, transcription factor, transcription factor family, number of input regions found with TFBS, boxplot and beeswarm plot of CpG beta scores inside the found TFBSs, de novo MethMotif logo for the fetched TFBS and detail files to download. The detail files include:
3.1. The regions with the TFBSs: the first N columns are from users' input columns (N is the number of columns in input file) and the next five columns are the chromosome, start, end, strand and sequence of TFBS found in the given genomic regions
3.2. CpG beta score within the found TFBS: the first 5 columns are the chromosome, start, end and sequence of found TFBS, while the last 4 columns are the chromosome, start, end and beta score (%) of CpG located within the TFBS.
3.3. Beta score matrix of MethMotif logo. A MethMotif logo will be de novo generated based on the fetched TFBSs mapped out in the input genomic regions. Correpsponding beta score matrix is provided: the first row is the nucleotide orders of TFBS sequence; the next three rows are the amounts of CpGs, whose beta scores less than 10% (2nd row), 10-90% (3rd row) and more than 90% (4th row), in the corresponding positions.
Users can download full results in a zipped file. An "index.html" file inside can be opened in a web browser to easily access to analysis results locally.
ChIP-seq raw datasets in various cell types used in MethMotif datasets were downloaded from ENCODE consortium (Details see "MethMotit Updates"). After read quality check by FastQC and read trimming as needed using Trimmomatic, short reads were aligned to human genome assembly hg38 using STAR with spliced function blocked. STAR has been proved as a competent DNA aligner with speedy and accurate aligning performance (Mark Ziemann 2016). Using Irreproducibility Discovery Rate (IDR) pipeline, TF genomic occupancy regions with high consistency in replicates were called by MACS2.
We took the advantage of WGBS to query whole genome wide DNA methylation. WGBS datasets were obtained from ENCODE consortium and GEO datasets (Details see "MethMotit Updates"). Raw datasets underwent read quality check by FastQC, as well as quality and adapter trimming using Trim Galore. Short reads in high quality were aligned to hg38 with Bismark using Bowtie2 and the default parameters. Methylation states in CpG context were extracted by Bismark methylation extractor module. For WGBS datasets with biological replicates, replicates were merged to increase the sequencing coverage after the correlation coefficient between them was confirmed using methylKit.
Integrative analysis of ChIP-seq and WGBS datasets was employed to profile methylation landscapes surrounding the genomic occupancy regions across all ENCODE ChIP-ed proteins. For each ChIP-ed protein, methylation scores of CpGs within +/- 100 bp surrounding its peak summits were collected. For each cell type, the distribution of the collected CpG methylation scores aforementioned across all ChIP-ed proteins was shown as a heatmap and the proteins were clustered into different groups according to the DNA methylation landscapes surrounding their binding regions.
We employed MEME-ChIP package with the default parameters to identify motifs for sequence-specific binding TF in +/- 100 bp surrounding TF peak summits. Since the actual binding sites for the ChIP-ed TFs are prone to central enrichment and maximum probability in occurrence at peak centers, motif for each TF was determined by its centrally enriched propensity profiled by CentriMo in MEME-ChIP package. Then, the real genomic binding sites were scanned out accordingly by FIMO module in MEME-ChIP package. Integrated with WGBS, the methylation states of CpGs within the binding sites were extracted.
In order to intuitively exhibit the methylation levels in TFBS, we adopted a novel MethMotif logo. For each TF in a cell type, we utilized WebLogo3 to show the enriched binding motif, while the stacked bar plot above the motif logo displays the number of CpGs, whose methylation scores lie in corresponding one of three interval groups (methylation score less than 10%, more than 90% and in-between), at each position in the motif.
 human
human mouse
mouse plant
plant